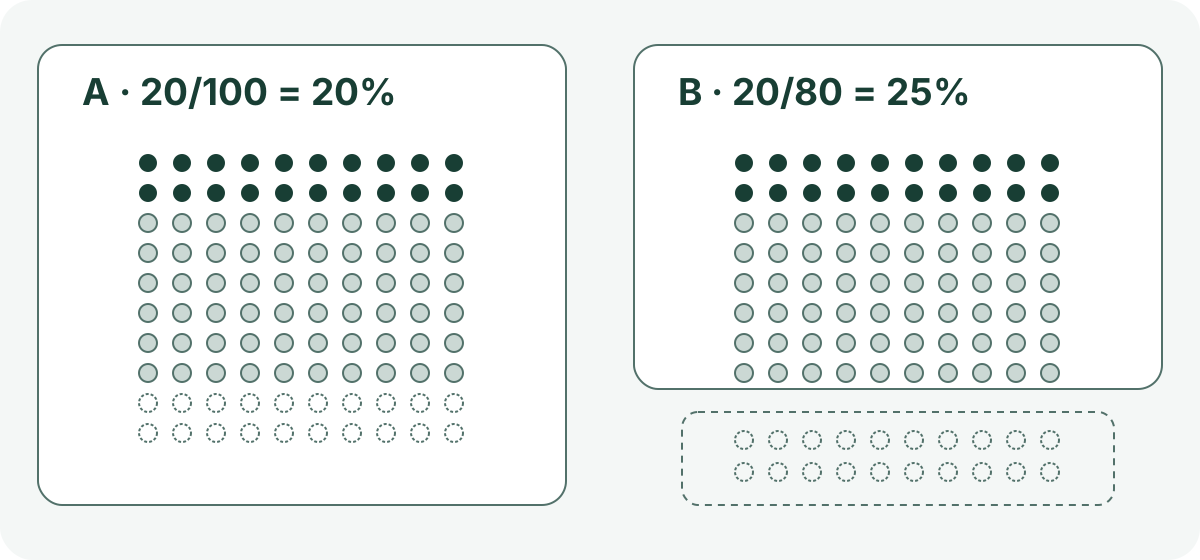
All numbers are fictional. Each dot represents one person. Dark dots are 20 observed qualifying outcomes; pale dots are 60 observed non-qualifying outcomes; outlined dots are 20 missing outcomes. This is one cohort, not two treatments.
- A · 20 / 100 = 20%
All enrolled people remain in the denominator. The missing outcomes are treated as not meeting the endpoint for this calculation, not known to be smoking.
- B · 20 / 80 = 25%
Only people with data remain in the denominator. Removing missing observations changes the percentage, not the count meeting the endpoint.
Find the count hidden behind the headline
For a binary outcome, the numerator counts people meeting the stated criterion; the denominator identifies the population used in that calculation. CONSORT asks trial reports to give the analysed numbers, available data at each outcome time and each group’s result. An enrolment total is not necessarily the denominator of every later percentage.
Keep ‘assigned’, ‘received the intervention’, ‘followed up’ and ‘analysed’ separate. If an advertisement says only ‘25% success’, the absent counts are a reporting gap, not permission to assume who was included.
One fictional cohort, two denominators
Invented numbers, not a study: 100 people enrol. At the stated assessment, 80 have outcome data: 20 meet the same fixed criterion and 60 do not. The other 20 have no outcome data. Dividing the 20 observed qualifying outcomes by all 100 gives 20%; dividing them only by the 80 with data gives 25%.
These are two calculations on the same cohort, not success rates for two interventions. The numerator has not increased. If the first calculation treats missing outcomes as not meeting the criterion, that is an analysis convention; it does not establish that those 20 people actually smoked. Neither calculation is automatically the unbiased answer.
Make the word ‘success’ do some work
A report should define the outcome and its assessment time. Check whether it counts stopping smoking, reducing consumption, attending visits or satisfaction; those are different outcomes. Also check whether the displayed figure is the prespecified primary outcome or a secondary result.
For a cessation result, keep the visit date separate from the behaviour window. ‘Assessed at six months’ might mean no smoking in the preceding seven days, rather than continuously for six months. Product scope and verification also affect whether two percentages describe the same thing.
Missing results need a method, not a guess
Look for how many results are missing in each group, why they are missing, the stated analysis method and any sensitivity analyses under different assumptions. Restricting analysis to available observations, imputing an outcome and using a statistical model are not interchangeable choices.
CONSORT explains that missing-data methods rely on assumptions. Simple replacement rules are not guaranteed to be conservative or unbiased. A missing person is not a measured outcome; a more complete-looking percentage cannot make that uncertainty disappear.
‘Twice as many’ and ‘ten percentage points’
Another arithmetic example, entirely fictional: two genuinely comparable groups each contain 100 people; 20 meet the endpoint in one and 10 in the other. Their proportions are 20% and 10%. The absolute difference is 10 percentage points; the relative ratio is 2. Neither means an extra 20 percentage points.
This invented contrast has no confidence interval, randomisation evidence or real intervention behind it. It demonstrates units, not effectiveness. In an actual trial, seek the absolute and relative comparison with its uncertainty, not just an impressive relative headline.
Leave uncertainty attached to the result
An estimated difference should come with its precision, commonly a confidence interval. A wide interval leaves more uncertainty about the size of the difference. Its presence does not repair biased follow-up or incompatible outcomes. Results from selected participants and a particular service context are not a personal forecast.
Before using a rate to choose care, bring the original report to a qualified local professional and ask: does this population, support setting, outcome and follow-up answer my question? That discussion is different from asking a website to calculate your own chance of quitting. In England, the NHS local Stop Smoking Service directory is a starting point for finding a service to contact; it does not establish that a published percentage applies to you.
What to keep in mind
Common questions
Can I recover the counts from a rounded percentage?
Not reliably without the denominator. Many different counts produce the same rounded rate. Look for the result table or ask the publisher.
Should everyone missing follow-up always count as smoking?
Do not invent a universal rule. Read the prespecified method and its assumptions. Classifying a missing outcome as not meeting an endpoint is not observing that the person smoked.
Is a four-week rate comparable with a six-month rate?
Not directly just because both are called quit rates. Check follow-up, the behaviour window, products, verification, population and denominator first.
Does a study rate give my chance of quitting?
A group result does not establish an individual probability. Its relevance to care needs context and qualified professional discussion, not a personal prediction from the headline.
Sources
The central claims on this page were checked against the sources below.
- SPIRIT–CONSORT Group: CONSORT 2025 — item 26: Numbers analysed, outcomes and estimation
Sources checked: 2026-10-01
- SPIRIT–CONSORT Group: CONSORT 2025 — item 14: Prespecified outcomes and time points
Sources checked: 2026-10-01
- SPIRIT–CONSORT Group: CONSORT 2025 — item 21c: Missing data and sensitivity analyses
Sources checked: 2026-10-01
- Society for Research on Nicotine and Tobacco / Piper et al.: SRNT — Defining and Measuring Abstinence (2019 online; 2020 issue), time windows and product scope
Sources checked: 2026-10-01
- Cochrane / Schünemann et al.: Cochrane Handbook 6.5 (2024), chapter 15 (updated August 2023): precision and applicability
Sources checked: 2026-10-01
- NHS Better Health: Find your local Stop Smoking Service (England)
Sources checked: 2026-10-01
Research-reading education with explicitly fictional arithmetic. No treatment ranking, real success-rate estimate or individual prognosis is provided.